Posted on Leave a comment

Veterinary Oxygen Costs: Generator vs. Delivered Cylinders: A Case Study

Field data

We metered the oxygen flow at a large veterinary hospital every ten seconds for four weeks. Here is what that oxygen would have cost in delivered cylinders — including the part that never appears on the invoice.

933,000 L oxygen used per month
130 H tanks in equivalent oxygen
27 hrs monthly staff time to handle them
$0.27 for an HVO system to generate 1,000 L on site

Delivered oxygen for this practice would run somewhere between $25,000 and $131,000 a year, depending entirely on what their gas supplier charges. Generating it on site costs about $2,400 a year in electricity and cooling. Put in comparable terms: oxygen generated on the premises cost this hospital about $0.27 per 1,000 liters, against $2.25 to $11.73 per 1,000 liters for delivered H cylinders, depending on the supply contract. Even measured against the lowest institutional gas pricing we could document anywhere in the country — pricing no private practice will ever be offered — the system pays for itself in about thirteen months. At the prices a practice actually pays, it is closer to three to five.

How much oxygen does a veterinary hospital actually use?

Ask a practice manager how much oxygen the hospital uses and you will usually get an answer in deliveries. Two a week. Ten per month. The invoice total. That is not usage — it is procurement. It tells you what you bought, not what you needed, and it cannot tell you whether the next busy day will outrun your supply.

So we put a flow meter on the line and logged it every ten seconds for a month, alongside the pressure in the storage tank.

In this case, the practice is a multi-doctor emergency and specialty hospital. Oxygen feeds six anesthesia machines and an ICU cabinet with four chambers, each about three feet on a side, run from a central controller that maintains a set oxygen percentage in each chamber independently. Four ICU cages is large for a veterinary practice — many clinics have none, quite a few have one or two, so four puts this hospital near the top of the range.

When you’re using delivered cylinders, you can count tanks to get a rough handle on a monthly total. But that monthly total won’t tell you what size generator the practice actually needs. The graphs shown below compare two metrics for an HVO system: tank pressure and liters-per-minute outbound to the hospital.

Two stacked charts across one day. The top chart shows oxygen demand in liters per minute swinging erratically between near zero and 113 LPM, with a shaded band marking the 54 to 60 LPM the system generates. The bottom chart shows tank pressure sawtoothing between 100 and 160 psi, dipping to about 59 psi during a sustained morning draw.
One day of oxygen demand, and the tank pressure underneath it. Demand swings from almost nothing to 113 liters per minute — roughly double what the system generates — and the stored reserve absorbs it. This was the heaviest day in the month we recorded.

Demand ranged from under 5 liters per minute to 113 LPM sustained for ten minutes. Average draw was 21.6 LPM. If you sized a system on the average you would be wrong; if you sized it on the peak you would buy roughly five times more machine than the hospital needs. The key is to determine the maximum draw of each oxygen-consuming device, and how many are likely to be in use simultaneously. You can exceed the production rate of the oxygen generator for a short time, but not indefinitely.

What 933,000 liters looks like in H cylinders

A standard H cylinder holds about 7,200 liters. At 933,000 liters a month, this hospital would go through about 130 of them — roughly four and a half every day.

Picture that before you price it: a delivery every three days at minimum, a storage room dedicated to a battery of chained high-pressure tanks (each one about 150 pounds full), and someone walking a hand truck down a hallway several times a day — a hallway that also has patients in it.

You do not rent 130 cylinders a month. You rent the whole standing inventory, though you’ll only have a small number of tanks connected to your central lines at a time.

To burn 130 cylinders a month on two deliveries a week, you need roughly 38 on site at any given moment: the ones in use, the full ones staged behind them, the empties waiting for pickup, and enough slack that a missed delivery is not an emergency. Drop to one delivery a week and you need closer to 68. You pay rent on all of them.

What do oxygen cylinders cost a veterinary practice?

Gas suppliers quote privately, and pricing swings enormously with volume and region, so we built the range from published figures rather than guessing at one number.

Annual cost of 130 H cylinders a month
Scenario Gas Rental Delivery Hazmat Total
Large institutional contract $25,160 $25,160
Mid-market account $69,975 $3,648 $2,610 $1,566 $77,799
Small account, retail rates $116,625 $6,384 $5,220 $3,132 $131,361

Assumes a 38-cylinder standing fleet and roughly two deliveries per week.

That $25,160 low-end figure is real, not hypothetical, and it is worth understanding what it represents. The University of Florida’s contract with Airgas prices a size-300 medical oxygen cylinder at $16.18 delivered — with no delivery charge and no hazmat fee at all. That is the buying power of a research university with tens of thousands of cylinder transactions a year. It is the best documented price in the country, and it is not available to a veterinary hospital.

What a practice actually sees looks more like the bottom two rows: a per-cylinder gas charge several times higher, monthly rent on every cylinder in the building, a delivery charge per stop, and a hazmat fee on top of that because compressed oxygen is a regulated material and somebody has to be licensed to drive it to you.

The labor cost of managing oxygen cylinders

Every one of those 130 cylinders has to be handled by a person, and that person is almost always a credentialed technician.

Monthly labor to run 130 cylinders
Task Frequency Each Hours
Cylinder changeouts 130× 8 min 17.3
Receiving and staging deliveries 30 min 4.3
Moving empties for pickup 20 min 2.9
Ordering, inventory, invoice reconciliation 30 min 2.0
Total 26.6

Twenty-seven hours a month. At the national average veterinary technician wage of $23 an hour, loaded to about $30 with payroll taxes and benefits, that is roughly $9,500 a year.

But the dollar figure misses the real cost. That is twenty-seven hours a month of licensed clinical staff moving steel instead of touching patients — time that could go to anesthesia monitoring, client communication, or just going home on time, in a field that’s already short-staffed.

What does a centralized oxygen generator cost to run?

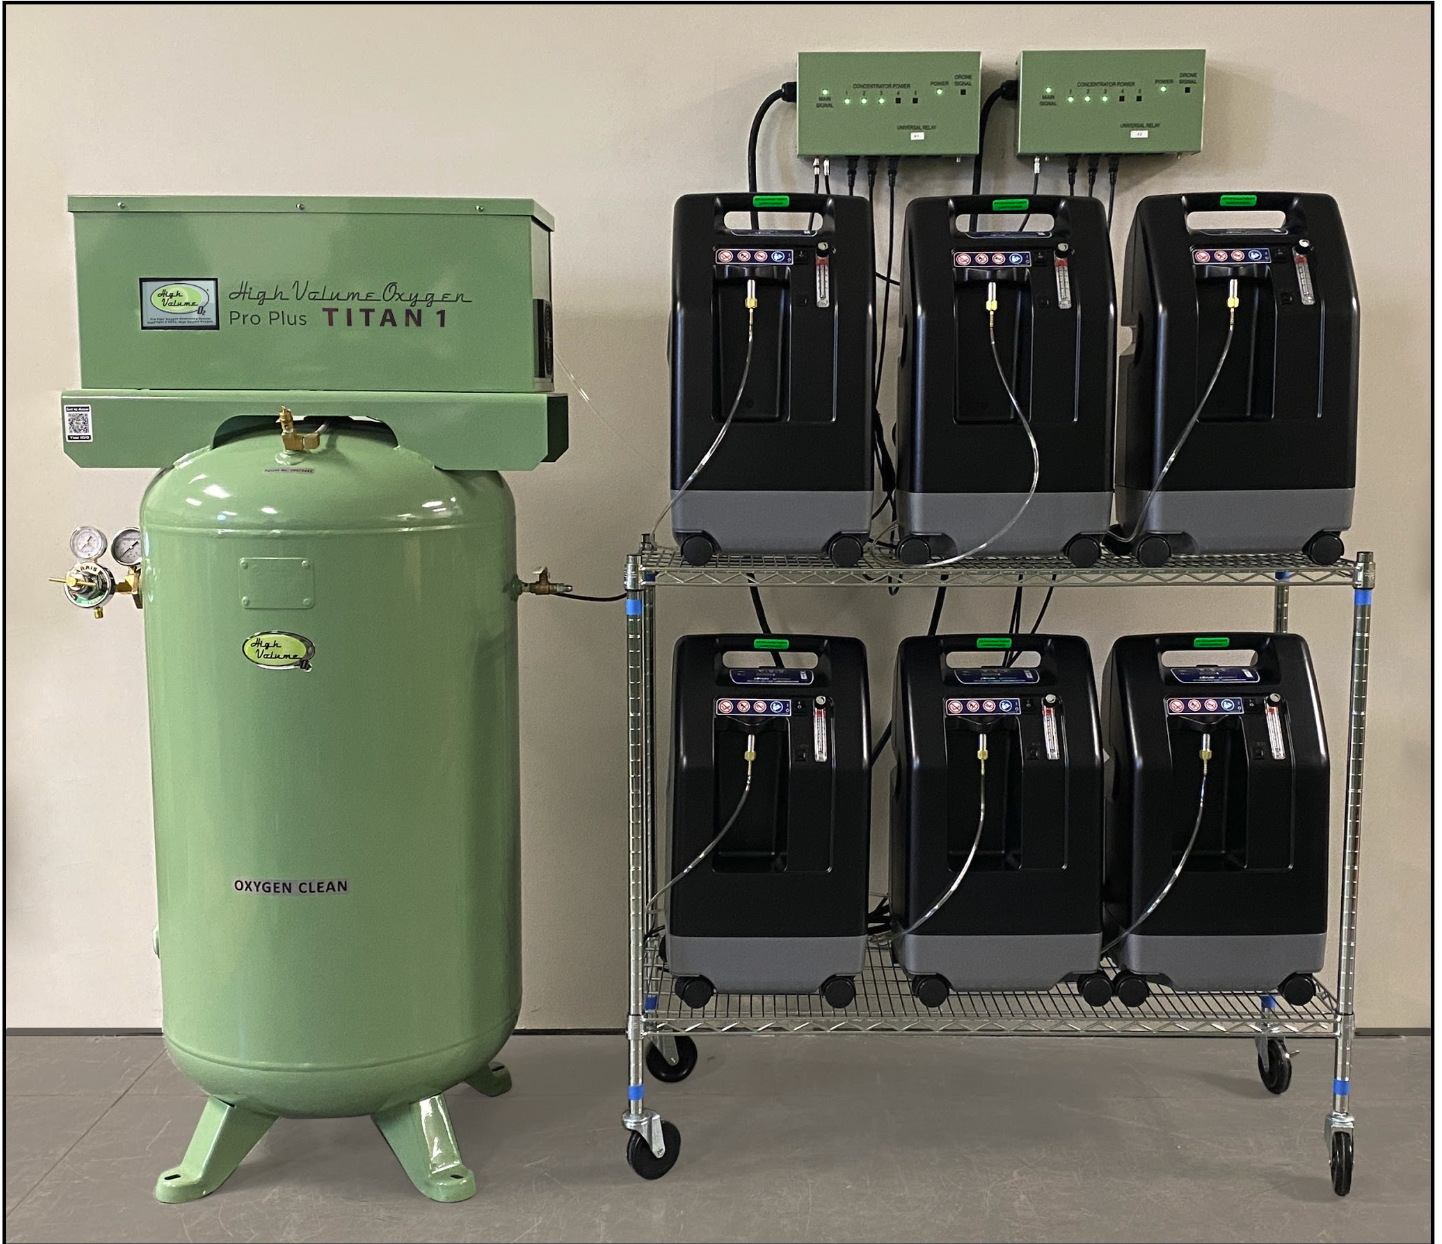
A centralized oxygen generator — one system piped to every point of use, not a portable concentrator at the bedside — trades a recurring bill for a capital purchase and an electricity meter. These systems run a bank of oxygen concentrators feeding a pressurized storage tank, and the hospital draws from the tank rather than from a cylinder. For an oxygen generator sized to this hospital — 60 LPM with an 80-gallon tank — here is the whole picture.

Centralized oxygen generation, this configuration
Oxygen generator, MSRP $33,390
Shipping $1,500 – 2,000
Electricity — 4.2 kW draw, running about half the time $2,160 / yr
Added cooling load — 3,600 BTU/hr $224 / yr
Maintenance, 2% of purchase price $668 / yr
Annual operating cost $3,051 / yr

Electricity at $0.125/kWh. Maintenance is covered under the three-year warranty, concentrators included, so real years one through three run about $2,384.

That works out to 27 cents per 1,000 liters of oxygen generated, against $2.25 per 1,000 liters at the best institutional cylinder pricing in the country and $11.73 at retail. Put another way, a single kilowatt-hour of electricity makes roughly 650 liters of oxygen.

Two prerequisites are worth checking before anyone gets excited about the arithmetic. The system needs a room between 50 and 80°F with six to eight air changes an hour — a mechanical space, not a closet. And because this is a centralized solution, the hospital needs piped medical gas lines running to each point of use. A practice that currently wheels a cylinder to whichever room needs it is looking at a plumbing project, not just an equipment purchase.

What each option actually costs you

Both options come with strings attached — they’re just different strings, due at different times.

To buy an oxygen generator requires decisions to be made about the clinic’s O2 needs: how much capacity, sized against what demand. Get that right and generation sits comfortably above your peak, with room to add capacity later if the practice grows. At HVO, we can help you get this number right, as we’ve been sizing systems since 2011.

Delivered cylinders provide a fixed amount of oxygen that will run out at some point. You’ll contract for some number that will arrive weekly or monthly. There are deliveries to receive, floor space to give up, and in this clinic’s scenario, roughly 130 units at about 150 pounds each — every one of them secured, moved, connected and returned by hand. That workload grows with every additional liter. There’s no volume at which cylinders get easier.

Every option has limits. The real question is which costs you’d rather carry, and for how long.

A caveat about oxygen costs

The cylinder costs in this case are modeled, not invoiced

That’s because the clinic in this example had already purchased an HVO system by the time we started measuring their usage. They are a new hospital, so there was no history of delivered cylinder costs. The cost figures we used are built from published university contract pricing, published rental rates, and published hazmat fees — not from one hospital’s bill. Real pricing may land anywhere in that range, so your own invoices are the only numbers that matter for your practice.

Common questions about veterinary oxygen costs

How many liters of oxygen are in an H cylinder?

A standard H cylinder (also called a size 300 or K cylinder depending on the supplier) holds approximately 7,200 liters of oxygen at 2,200 psi. That is the figure used throughout this article to convert measured usage into cylinder counts.

How much oxygen does a veterinary hospital use per month?

The hospital in this study used 933,000 liters per month, an average draw of 21.6 liters per minute with peaks reaching 113 LPM. This is a large consumer — a multi-doctor emergency and specialty practice running six anesthesia machines and a four-chamber ICU. A general practice with one or two anesthesia machines and no ICU would use a small fraction of this.

How much does medical oxygen cost per liter?

Delivered in H cylinders, oxygen cost between $2.25 and $11.73 per 1,000 liters in our modeling, depending on whether the buyer holds a large institutional contract or pays small-account retail rates. Generated on site with an oxygen generator, the same 1,000 liters cost about $0.27 — roughly one kilowatt-hour of electricity makes 650 liters.

Is an oxygen generator cheaper than delivered oxygen cylinders?

Above a certain volume, substantially. The comparison turns on how much oxygen you actually use: a generator’s cost is mostly fixed, while cylinder cost scales with every liter. At this hospital’s 933,000 liters a month, centralized generation was roughly eight to forty times cheaper per liter. At a fraction of that volume the gap narrows and cylinders can be the better answer, which is why measuring usage comes before any purchase decision.

How long does an oxygen generator take to pay for itself?

At this hospital’s usage, between three and thirteen months. The thirteen-month figure assumes the buyer already pays the lowest documented institutional cylinder pricing in the country; three months reflects retail rates. Over five years the difference totals $125,000 to $656,000.

What does a veterinary oxygen generator cost?

A 60 LPM system with an 80-gallon storage tank — the configuration sized to this hospital — has an MSRP of $33,390, plus roughly $1,500 to $2,000 shipping. Operating cost runs about $3,051 a year including electricity, added cooling load, and maintenance budgeted at 2% of purchase price.

What does installing a centralized oxygen generator require?

Three things. Piped medical gas lines to each point of use, since a generator is a centralized source rather than a portable cylinder. A mechanical room held between 50 and 80°F with six to eight air changes per hour. And electrical capacity for a 4.2 kW draw. A practice without existing medical gas piping is looking at a plumbing project alongside the equipment purchase.

Is oxygen from a generator the same purity as cylinder oxygen?

Not identical. Concentrator-based systems typically deliver oxygen in the 93 to 95% range, measured continuously at this installation, while delivered medical cylinders are approximately 99%. The balance is argon and nitrogen rather than any contaminant. Oxygen at 93% is a recognized medical concentration with its own USP monograph, and is widely used clinically — but the difference is real and worth discussing for your specific applications.

Five-year cost: cylinders vs. centralized oxygen generation

Everything above is one month of data. Multiply it across the life of the equipment and this stops being a line item — it becomes a capital decision.

Line chart of cumulative oxygen cost over five years. Three rising lines for delivered cylinders reach $173K, $437K and $704K depending on supplier pricing, while centralized generation stays nearly flat at $48K after the initial purchase. Dots mark where the system has paid for itself, between month 3 and month 13.
Cumulative cost including gas, cylinder rental, delivery, hazmat fees and the staff time to handle it all. Centralized generation carries its cost up front and then goes quiet.
$125,000 saved over five years, measured against the best institutional cylinder pricing we could document anywhere $656,000 at retail rates
1,596 hrs of licensed technician time returned to patient care instead of moving steel ≈ 40 work weeks
7,800 cylinders never delivered, never stored, never chained to a wall, never wheeled down a hallway 130 every month

Five-year totals. Cylinder figures include the labor burden; generation includes purchase, shipping, power, cooling and maintenance.

Start by measuring your oxygen usage

The hospital in this data had been running for years on an educated guess. When the numbers finally arrived, the surprise was not the total — it was that the load never let up. Demand overnight ran within four percent of demand at midday, which means there is no quiet hour to plan around, and no version of this hospital where a smaller number would have been the right answer.

None of that was visible from an invoice. It took a meter.

If you want to know what your hospital actually uses, we will meter it and tell you — whatever the answer turns out to recommend. Either way, you’ll have your own numbers instead of a guess.

Usage figures are from continuous flow and pressure telemetry at a customer site, anonymized. Cylinder pricing modeled from the University of Florida–Airgas contract rider, published university cylinder rental schedules, and published carrier hazmat fees. Wage data from Salary.com, 2026. An H cylinder is taken as 7,200 liters.

High Volume Oxygen · Lincoln, Nebraska · info@highvolumeoxygen.com · (402) 476-0555

Posted on 3 Comments

How much does oxygen cost?

A Mass of Gas

This simple question has a not-so-simple answer, as there are many factors that influence the cost of oxygen. Gas company prices vary significantly depending on where you’re located, whether you’re getting scheduled deliveries, and whether you have an annual contract. The amount of oxygen you use will impact the cost of compressed, liquid, and generated oxygen. To make the most economical choice, let’s examine your requirements.


How much oxygen do you need?

To quantify oxygen, you may use volume, weight, or flow rate. For volume, the common unit in the US is standard cubic feet (SCF), whereas Europe and elsewhere use standard cubic meters (M3). If your concern is weight, gas is commonly measured in pounds or kilograms. For flow, it’s typically SCFM (standard cubic feet per minute), SCFH (standard cubic feet per hour), or SLPM (standard liters per minute).

To understand the meaning of the word “standard” in these units of measurement, read this article. It’s pretty important. The short explanation is that the “S” in SCFM implies standard temperature and pressure, whereas CFM implies actual temperature and pressure.

Calculating vs. Testing

It’s not easy to calculate your oxygen requirements accurately, as there are many variables to put into the equation. For this reason, I recommend setting up a simple test in which you measure oxygen usage with a flow meter such as the HVO Oxygen Tracker, and, if needed, a temporary oxygen source, such as a compressed tank. Find your actual flow rate by measuring usage in an isolated part of your system, e.g. one nano-bubbler or one diffuser. You can extrapolate from the test to calculate your overall requirements. See this article about the benefits of a flow sensor that can store data in the cloud.

Delivered LOX

If you use a large amount of oxygen, you may want to install a permanent, on-site LOX tank. For this privilege, the gas company will charge you $20,000+ for the tank, evaporator and other equipment. This setup requires a concrete platform that you must build. For the LOX itself, you’ll pay a price per 100 CF, as well as delivery and other fees.

To get a permanent, on-site LOX tank, you’ll have to sign a contract with the gas company that will lock you into a price for at least a year. Pay careful attention to the contract language, as these contracts typically renew automatically and may require you to cancel well in advance if you intend to renegotiate.

Delivered Tanks

The price of delivered oxygen takes into account your distance from the gas company. They’re not going to haul those big steel tanks for free. You must schedule your delivery in advance or you’ll have to pay for expedited service. There’s always the possibility of a price increase, or being denied service because, for example, the tanks you own are deemed unsafe. If you don’t own tanks, you’ll pay a rental fee. During bad weather, it may not be possible for the delivery truck to reach you.

Before getting tanks delivered, check your local zoning ordinances. It may be illegal for you to use compressed or LOX tanks in your office building or home. For good reason, fire marshals are generally much less concerned about generated oxygen tanks that achieve a high pressure of 150 PSI vs. compressed tanks at 2200 PSI.

Also, make sure that you understand the coverages in your insurance policy pertaining to the use of oxygen in your home or business.

Generated Oxygen

For many applications, the argument for making your own oxygen is hard to counter: it’s safer (low pressure tanks), easier (no tanks to lug), and much less costly than delivered oxygen. The cost per kilogram for HVO systems is in the range of 7-10 cents, depending on the scale, and larger systems are generally the most economical. The time to break-even is typically from 9 – 18 months.

No Wasted Gas

Liquid oxygen tanks will periodically blow off pressure, which can be alarming if you’ve never experienced it. The pressure in the LOX tank builds until a safety blow-off valve achieves its release pressure. The resulting ejection of oxygen creates a loud sound like a steam locomotive coming to a stop. A LOX tank may blow off as much as 10% of its contents every day. That’s oxygen that you’re paying for, but getting no benefit.

With oxygen generation, you make what you need, so there’s very little waste.

Eliminate Contamination

If tanks are delivered and empties removed on a regular basis, people will be going in and out of your facility with hand-trucks and tanks. Both the delivery person and the tanks may be contaminated with a variety of substances. I’m not talking about poisons, necessarily, but detritus like mud and dust that may contain seeds, spores, bacteria, and viruses. If you’re running a clean, indoor facility, using generated oxygen will prevent those contaminants from entering your environment.

You can improve the situation somewhat by using medical-grade oxygen, which is delivered in clean tanks. However, this only strengthens the financial argument for generated oxygen, as medical-grade oxygen is even more costly than industrial grade.

Never Run Out

For some businesses, the cost of running out of oxygen is perhaps higher than any other cost. If you’re using delivered oxygen to support the life of animals (e.g. in a vet facility), or aquatic life (in a fish farm), running out unexpectedly could result in a significant financial loss.

With generated oxygen systems, if you have power, you have oxygen. Having a backup power generator will ensure that you always have power. It may also be beneficial to keep backup oxygen tanks on standby in the event of an extended power outage.

Not for Everyone

There are two cases where I would say that delivered oxygen is a better alternative to making your own. First, if your consumption rate is greater than 10,000 SCF of oxygen per day, the economics may be better for LOX. Second, if you must have 99.99% pure oxygen, compressed tanks and LOX are your only alternatives. Generated oxygen systems produce 93-95% pure oxygen, which is enough for the majority of applications, but not for all. Laser cutters, for example, require 99.99% pure oxygen.

Real Numbers

In November, 2019 I saw prices for a single 300 CF compressed cylinder as low as $12 and as high as $85 — a 7X difference. Interestingly, those two prices came from the same gas company, in the same location! The high price was for a drop-in refill. The low price was for multiple, regularly-delivered tanks in a one year contract.

For liquid oxygen, this particular vendor quoted about $200 for a 180 dewar, which contains 4,650 SCF.

Results of Survey

From the responses I received in the TorchTalk and Concentrated Lampworkers forums on Facebook, I created a map of oxygen costs by location. The green markers are for compressed gas, while the blue ones are for liquid oxygen.


Return on Investment (ROI)

Below we’ll look at a 3-year return on investment model in which we compare an HVO system to compressed and liquid oxygen delivered by your local gas company.

Head-to-Head with Compressed O2

In this scenario, assume that your usage is three K tanks per week, which is equivalent to about 750 cubic feet of oxygen. You work 5 days a week, 8 hours a day, and you get a delivery of three tanks every week. According to the data shown in the map above, the median price per K tank is $20. Using that number, your cost for delivered oxygen will be $60 per week plus delivery, tank rental, and hazmat charges that will amount to at least $40 per week. That’s $100 x 52 = $5,200 per year for K-tanks.

Let’s further assume that you require no more than 30 PSI of line pressure, and that your average flow rate is 15-20 LPM with short bursts of 30 LPM. For this application, we would recommend an HVO Classic 20-gallon system with two 10 LPM oxygen concentrators at a retail cost of $7,800 (keep your eyes peeled for sales).

Cost of Power and Maintenance

For this usage pattern, the cost of electricity will be about $2.90 per day, or $754 a year, assuming an electricity cost of roughly 0.07 per kWh (which is the average national cost for industrial power). There’s also a maintenance cost, which we’ll assume is 1% of the purchase price per year (mostly for concentrator filter replacement), which averages $7 per month. Thus, the combined power and maintenance cost to run the HVO in this scenario would be $7 + $63 = $70 per month.

Here’s how it breaks down:

    • $5,200 / 12 = $433.33 <– monthly cost for delivered K tanks, including all fees

    • $7,800 / 36 = $216.66 <– monthly payment on HVO (36 months @ 0% interest)

    • $216.66 + $70 = $286.66 <– monthly payment plus power and maintenance

    • $433.33 – $286.66 = $ 146.67 <– your monthly savings over delivered K tanks

With an HVO system, your monthly costs will be lower, you won’t ever run out of oxygen, you won’t have to lug tanks or risk your life if you drop one, and your system will pay for itself in less than 27 months. At the end of three years you’ll have an extra $1,320 in your pocket. In 5 years, you’ll be ahead $4,840.

Head-to-Head with LOX

In this scenario, assume that you use a 180 dewar every day. That’s a massive amount of oxygen, but some applications (e.g. aquaculture, vertical farming) have very large consumption. In a 24 hour period, a 120 SLPM HVO system will generate about 24% more oxygen than is contained in a 180 dewar.

If your oxygen cost is $200 per dewar every day, that’s $200 * 365 = $73,000 a year for delivered oxygen vs. about $45,000 for an HVO 120 SLPM system that will keep on generating oxygen, year after year.

With this particular HVO system, you’ll pay about $418 per month for power and maintenance. Assume that you’re amortizing your HVO system over 36 months. Your monthly savings over delivered oxygen would be a whopping $4,415. Really. Let’s do the math:

    • $73,000 / 12 = $6,083 <– monthly cost of 180 dewars

    • $45,000 / 36 = $1,250 <– monthly payment on HVO (36 months @ 0% interest)

    • $1,250 + $418 = $1,668 <– monthly payment plus power and maintenance

    • $6,083 – $1,668 = $4,415 <– your monthly savings over delivered LOX

With this savings, you’ll break even in less than 17 months.

Think about it. You can buy delivered oxygen for $73,000 every year. Or, you can buy a 120 SLPM HVO system for $45,000, save $83,885 in the first three years and $52,980 every year thereafter. Not a tough decision.

How much are you paying?

It would be great to see comments from those of you who are using oxygen for industrial applications. How much does your oxygen cost?

Posted on Leave a comment

Using Time-Series Flow Measurements to Analyze Oxygen Consumption

By Dennis Kornbluh, CTO, High Volume Oxygen

Abstract: This post explains the benefits of maintaining a historical record of minute-to-minute oxygen flow rates. It shows how time-series graphs reveal oxygen consumption patterns, and how these patterns may be correlated with specific activities and events. It explains how a summary of total oxygen usage by week or by month can help to reconcile gas company bills, or plan for the implementation of a new oxygen solution, such as transitioning from compressed cylinders to liquid oxygen (LOX) or an oxygen generator. A scenario is described that illustrates how the use of time-series measurements increases the accuracy of oxygen usage predictions.

Introduction

Oxygen is a significant cost for many applications, from aquaculture to torchwork and scientific glass shops to veterinary clinics and hospitals. Oxygen prices rose significantly during the pandemic(1), and prices remain “sticky” even now in the spring of 2023(2).

With an expensive commodity such as oxygen, the cost of waste adds up quickly. For example, a three L/min line leak will blow off approximately 213 K tanks per year at a cost of $7-8K(3).

There are ways to economize on oxygen, e.g. by using less (e.g. finding and preventing leaks, training users to economize), purchasing an oxygen generator, or switching from compressed cylinders to LOX dewars or bulk LOX. However, before you choose an alternative, it’s important to have a good understanding of your current usage, which is likely to change over time. This may happen for a variety of reasons, such as seasonal business trends and special projects. The more you know about your usage patterns, the more accurately you can budget.

Gas company bills are a source of information that reveals the volume of oxygen that was purchased over a period of time. However, there are two issues with this source:

  1. The bills won’t shed much light on waste. For instance, it would be practically impossible to determine if you have a line leak by looking at monthly volume.
  2. The gas company might not be properly recording the number of tanks you use, perhaps because of administrative errors or faulty measurement devices. If you aren’t keeping an independent record of volume, you won’t know whether your gas company bills are accurate.

To get a more precise view of usage, it’s necessary to measure your oxygen flow rate at regular, sub-minute intervals, over a span of weeks or months. To reconcile oxygen bills, you must also  have independent knowledge of the total volume of oxygen consumed over the billing period.

Flow Measurement Devices

Velocity flow meters and mass flow sensors are commonly used to measure gas flow rates. A velocity flow meter provides a point-in-time reading, i.e. the current flow rate. Some flow sensors are capable of storing a limited amount of data in the device for periodic download. 

A recent alternative is a mass flow sensor that is able to store flow measurements in the cloud for instantaneous analysis and automated notification when flow rates exceed expected norms.

Velocity Flow Meter

A velocity flow meter measures the flow rate of gas by changing the height of a “float” (silver ball) in a graduated cylinder to indicate the approximate flow rate, typically in Standard Cubic Feet per Hour (SCFH) or Standard Liters per Minute (SLPM). You can also use a flow meter to set the flow to a desired rate.

For the purpose of recording flow measurements over time, a flow meter has several drawbacks: 

  • If you want to know what the flow rate was in the past, you need to make regular observations and record them manually. If you want sub-minute measurements, that’s practically impossible to accomplish without automation.
  • Flow meter accuracy ranges from ±5% to ±10% whereas mass flow sensor accuracy is typically ±0.5% to ±2%.
  • If the regulator pressure does not match the pressure for which the flow meter was designed, its measurements will be even less accurate.

On a velocity flow meter, the float may be viewed from different angles, which makes it difficult to take consistent readings. However, as a rough gauge of the flow rate, or to set the flow to an approximate rate limit, a velocity flow meter can be a useful tool.

Mass Flow Sensor

A mass flow sensor (MFS) is an electronic device that provides accurate measurements of mass and volumetric gas flow rates. These devices use a hot wire mass airflow sensor to measure the volume of gas entering the device. Its operating principle is similar to a hot wire anemometer, which determines air velocity.

Measurements are collected and converted to digital form, then stored, either in the device’s local memory, or by communicating over a network to another storage device. Some devices support a USB interface, enabling data to be downloaded to a memory stick. Others use RS-232 or RS-485 serial interfaces and must be connected to a receiving device that is designed to collect such data. For specific details about the options available, consult the device documentation for the flow device you are considering.  

Mass flow sensor products that store data on a USB memory stick or that transmit data over serial lines require technical skills to download, process, and format the collected data. This can be challenging for day-to-day use.

Keep in mind that mass flow sensors are designed with a set of capabilities, such as the maximum flow rate and maximum pressure. For example, if your line pressure is 50 psig and your flow rate can go as high as 100 L/min, ensure that the MFS device you choose can support those characteristics.

Cloud-Connected Mass Flow Sensor

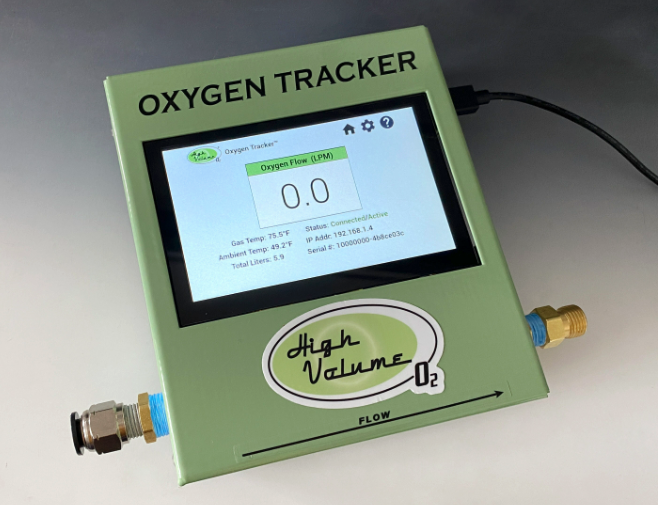
The HVO Oxygen Tracker is a mass flow sensor that provides a convenient alternative to labor-intensive and technically challenging flow devices that require data management. By storing flow measurements in the cloud every 10 seconds, the Oxygen Tracker prevents users from having to manually collect, store, and process data for viewing. Users with an active cloud subscription can access near real-time flow data displayed in a time-series graph on any web browser or mobile device.

The Oxygen Tracker is able to measure flow rates as small as 0.1 L/min and as large as 300 L/min with line pressures up to 100 psig. It can operate in environments where the temperature is 0 to 50 °C (32 to 122 °F). At 21.1 °C (70°F) and 14.7 psia (1 atm), the flow accuracy of the mass flow sensor is ±2% of the reading or 0.05 SLPM, whichever is greater.

Analysis of Graph Patterns

Visualizing time-series flow measurements is key to understanding how oxygen is being used in a given setting. Using an Oxygen Tracker, flow measurements were taken in a glass studio(6) over a 12 hour period. The resulting graph is shown below:

Figure 1. Glass Studio Flow Graph

From the graph above, we can make the following observations:

  • There was a flow rate of 0.318 L/min at 6:22AM, which is prior to the start of the work day. This is most likely due to a small leak somewhere in the studio.
  • Just before 7AM, a ball valve was opened that permits the lines in the studio to be filled with oxygen. This caused a spike to almost 80 L/min.
  • There are variations in the flow rate throughout the work day, with a maximum flow rate of approximately 58 L/min. The average flow rate appears to be roughly 30 L/min.
  • During the sample period, an oxygen generating system capable of producing 60 L/min would be able to keep pace with demand during peak intervals, and a 30-40 L/min system might actually be sufficient, given that stored oxygen provides the buffer needed during periods of high usage. 

Longer sample periods may make it possible to more accurately estimate oxygen usage.

While the glass studio flow graph illustrates a chaotic usage pattern, some applications have more static flow rates. The graph shown in figure 2 (see below) reflects oxygen consumption in an aquaculture operation. During a 6 hour sample period, there is a constant flow of oxygen to a series of fish tanks, so the L/min graph line is nearly flat.

In an aquaculture setting, oxygen gas is converted to dissolved oxygen (DO) so that fish can breathe. According to Henry’s Law(5), the temperature of the water has an inverse relationship to the solubility of oxygen. Thus, the higher the water temperature, the less dissolved oxygen the water can hold. That’s why large fish, which require more oxygen than smaller fish, are struggling to survive in natural settings as global temperatures rise.

Figure 2. Aquaculture Operation Flow Graph

Based on the data in figure 2, one might be tempted to conclude that a flow rate of 10-12 L/min would be sufficient for this application. In reality, the flow rate must be adjusted according to a variety of factors, such as water temperature, fish breed, stage of life (fry, fingerling, adult), and even feeding schedules, since the metabolic rate of fish increases significantly during feeding.

Assumptions about oxygen usage based on a small sample could lead to a significant budget miscalculation. Indeed, the aquaculture operation from which this graph was obtained has since adjusted their constant flow rate to 15 L/min due to rising spring temperatures. Operations managers must periodically measure the DO that’s present in their tanks and make adjustments to the oxygen flow rate in order to achieve the desired levels. With a means to measure the actual volume of oxygen used over time, one is able to create an accurate forecast of the required oxygen volume.

For this reason, the Oxygen Tracker maintains a count of the total volume of oxygen used since the counter was last reset. With an up-to-date cloud subscription, up to a year of flow measurements are maintained in cloud storage. The Seeing Eye™ cloud service sends a weekly usage email report, a sample of which is shown in figure 3 below:

Figure 3. Weekly Oxygen Volume Report

There are several benefits to having detailed data for flow and cumulative volume. First, knowing your precise oxygen consumption over time takes the guesswork out of budgeting. It also makes it possible to determine the economics of alternative oxygen sources. For example, above a certain volume,  compressed oxygen cylinders become more expensive per unit of delivered oxygen than LOX dewars. At an even higher threshold, it may be more cost-effective to invest in the installation of a permanent LOX tank. In many cases, an oxygen generator might be more economical. Knowing your oxygen requirements in detail makes it possible to confidently calculate the potential savings from using alternative oxygen sources.

Scenario: A Glass Studio

In this section, we’ll analyze the oxygen used at a Connecticut-based glass studio(6). We’ll calculate the annual cost of oxygen based on monthly gas bills. For comparison, we’ll use measurements collected from a cloud-enabled mass flow sensor to compare predictions about oxygen volume to see how these predictions aid the studio in budgeting. 

NOTE: It’s also possible to estimate oxygen usage based on the characteristics of individual torches found in the studio. However, in a large studio, this is rather more complicated, due to the number and types of torches commonly used. Actual measurements are preferable to calculations that rely on assumptions.

What the gas bills reveal

230 Liter Liquid Oxygen Dewar

In 2022, Stoked Glass was purchasing 230L liquid dewars at the rate of approximately one per week at a cost $320 per tank. Thus, they were paying about $320 * 52 = $16,640 per year for oxygen. One of the challenges they experienced was ensuring that there was enough oxygen. Since their oxygen consumption was inconsistent, there were times when they would run out unexpectedly. For unscheduled deliveries, it was necessary to wait 3-5 days before oxygen would be delivered. In these circumstances, the shop had to shut down, resulting in significant losses in production and revenue.

In mid-2022, the local oxygen supplier was acquired by AirGas, and prices immediately went up. This led to the glass studio’s decision to purchase an oxygen generator.

The gas bills reveal how much oxygen is being purchased by week, month, and year, and the cost in those time frames. However, they can’t be used to determine how much oxygen is wasted due to off-gassing, line leaks, or inefficient usage. Nor can they use them to correlate the approximate cost of oxygen for individual projects. More granular usage information is needed to gain these types of insights, which are an aid to economize.

What the Oxygen Tracker reveals

At the end of December, 2022, an Oxygen Tracker was installed at Stoked Glass. After a few days, they were able to look at graphs that show a profile of the specific oxygen flow rates they experience throughout the day. The graph below shows a 96 hour period, which provides some insight into daily usage patterns:

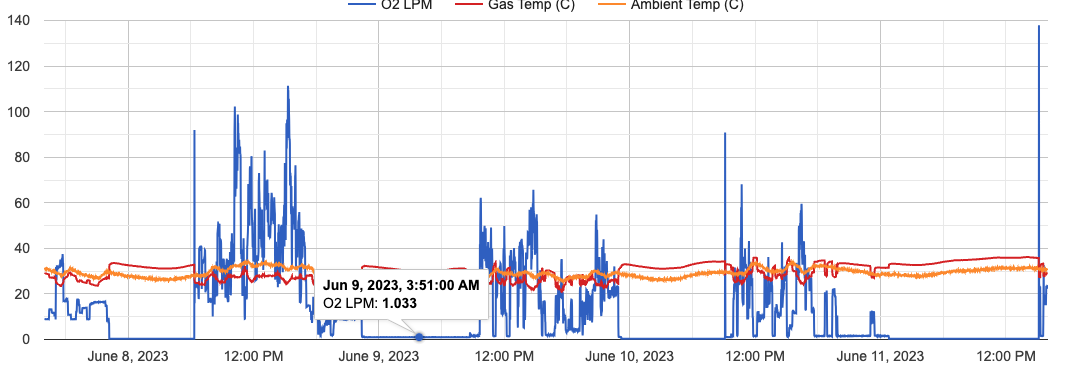
Figure 4. A time-series graph showing 4 days of oxygen flow rates

From the graph above, we begin to understand what a typical day looks like in terms of expected flow rates. Here are a few insights we have gained:

  • More oxygen was consumed on June 8th than in the next three days.
  • Work started at 9am EDT on June 8, 11am EDT on June 9, and 1pm EDT on June 10
  • At the end of the day on June 8th, someone forgot to turn off the ball valve that releases oxygen to the studio gas lines. We know this because 1) there was no spike in the flow rate the morning of June 9th indicating the opening of the ball valve, and 2) there was a leak of just over a liter per minute for about 12 hours, which is greater than the usual leak of about 0.3 LPM.
  • The maximum flow rate reached 110 L/min, but flow rates from 40-80 L/min were more typical.
  • The average flow rate over this brief period was approximately 40 L/min.
  • Coupled with the knowledge of who was in the shop on a given day and time, one might identify prodigious users of oxygen – not to point fingers, but perhaps as an opportunity to train more efficient techniques.

That’s quite a few valuable insights from a single graph. Visualization of flow data is an excellent way to understand the utilization of this valuable resource. Having a year’s worth of data could enable managers to budget more effectively, as well to be able to correlate projects with oxygen cost to better account for the shop’s own costs.

Conclusions

  • Analog flow measurement devices provide point-in-time readings, which are of limited usefulness for making accurate forecasts.
  • Some digital flow measurement devices are able to save historical readings locally or transmit them to a database. However, data processing is needed to produce graphs and other kinds of reports, which is challenging for small organizations.
  • Having easy access to granular oxygen flow rate data can facilitate more effective and more economical management of oxygen resources.

References

  1. Reuters reported in May 2020 that the cost of medical oxygen had risen by as much as 50% in some countries due to increased demand and supply chain disruptions. The Economic Times reported in April 2021 that the cost of medical oxygen in India had increased by more than 3-4 times due to the surge in COVID-19 cases. The Guardian reported in April 2021 that the cost of medical oxygen in Nepal had increased by up to 800% due to the surge in COVID-19 cases. The Straits Times reported in April 2021 that the cost of medical oxygen in Malaysia had increased by as much as 40% due to the COVID-19 pandemic.
  2. The unit cost of delivered oxygen can be difficult to parse out of a complicated invoice. There are many factors, such as compressed vs. liquid, distance of delivery, tank rental vs. stationary platform. Anecdotally, users of oxygen in the aquaculture, glass, and veterinary industries are purchasing oxygen generators such as HVO systems specifically because delivered oxygen continues to go up in price.
  3. A K-tank (aka H-tank) contains about 7400 liters of oxygen at a pressure of about 2200 psig. This calculation assumes a cost of $45 per K-tank.
  4. Wikipedia: https://en.wikipedia.org/wiki/Mass_flow_sensor
  5. Wikipedia: https://en.wikipedia.org/wiki/Henry%27s_law
  6. Stoked Glass of Bridgeport, CT is the glass studio that provided some of the information for this paper.
  7. Chart Industries liquid cylinder product manual
Posted on 1 Comment

Generate Oxygen with Solar Power

Is it feasible and beneficial to run an HVO oxygen generating system with photovoltaic (PV) solar panels? That is the topic I’ll be exploring in this post. I consulted with professional solar installers on the technical questions regarding modern PV solar systems.

The cost of PV solar power has come down 99% over the past 40 years. Meanwhile, “conversion efficiency“, which represents the amount of sunlight that is converted to electricity, is now as high as 22.8%. To bring the cost down even further, state and federal governments offer Renewable Energy Tax Credits.

Continue reading Generate Oxygen with Solar Power
Posted on Leave a comment

How to Care for your HVO System

You, When Everything is Working

You just made an investment in an HVO system because you want to save money on oxygen, have a safe work environment, and you like the idea of flipping a switch to make all the oxygen you need. Now you can focus on your business rather than having to check your tank levels, place orders, schedule delivery, replace empties, and pay oxygen bills.

To capitalize on your investment, put your system in a proper space and care for it so it can live a long and happy life. The things you need to do are pretty straightforward, especially if you begin with a little planning.

Continue reading How to Care for your HVO System
Posted on Leave a comment

How much oxygen do you need? (Part 2)

In part 1, we talked about the density of oxygen, gas measurement standards, and how to calculate gas volume for a container of a given size at a given pressure. In this post, we’re going to use that knowledge to configure an HVO system that is capable of producing the amount of oxygen that you require.

Continue reading How much oxygen do you need? (Part 2)
Posted on Leave a comment

How much oxygen do you need? (Part 1)

When you buy a container of ice cream, you may think that a quart is a quart until you learn that one brand contains a lot more air than another. You can weigh the two containers and you’ll know that the heavier one contains more product. The same is true for gases: two tanks may be “full” from the top to the bottom, but the volume of stored gas is based on density, which is mostly determined by pressure.

Like most common gases, oxygen expands to fill its container. But how much oxygen is actually inside? You may know that an oxygen cylinder contains some number of cubic feet of oxygen, but the cylinder doesn’t look like it could possibly hold that much. It’s the compressibility of oxygen that makes it possible to squeeze a mass of gas into a small space.

Continue reading How much oxygen do you need? (Part 1)
Posted on Leave a comment

How to Choose the Best HVO Model

HVO gives you a choice between a basic, reliable product, dubbed the Classic Plus™️, and the Pro Plus™, which has a built-in ultrasonic oxygen sensor, and is “cloud-connected”, with sophisticated data tracking, monitoring, and configuration options. In this post, you’ll learn the differences between them, and how to decide which is best for your application.

Continue reading How to Choose the Best HVO Model
Posted on Leave a comment

How do HVO systems work?

The HVO oxygen-generating system turns itself on and off automatically based on the pressure in the oxygen storage tank. It is programmed to keep the tank pressure within a range of “setpoints”. Here’s how it works:

  • When the system turns on for the first time, the tank pressure is at zero PSI. This triggers the “charging” process.
  • Charging consists of running the oxygen concentrators that are attached to the HVO system, compressing the generated oxygen, and storing it in an oxygen-clean tank.
  • Tank pressure is monitored continuously. When the pressure reaches the high threshold (100 PSI for the Standard, 150 PSI for the Mighty Mite and MAX), the system goes into “discharging” mode, at which point the oxygen concentrators and the compressor are turned off. All that can be heard is the quiet hiss of oxygen running through the regulator.
  • Once the pressure drops below the low threshold (30 PSI for the Standard, 100 PSI for the Mighty Mite and MAX), the charging process is triggered again.

If the oxygen generating capacity is well-matched to the output requirements, you’ll receive a continuous supply of oxygen.

Continue reading How do HVO systems work?
Posted on Leave a comment

How to expand your HVO system

Main/Drone/Storage

If you find that your oxygen requirements have grown since your original purchase or you’re thinking about buying a large HVO system, this post will be helpful.

Did you know that HVO has the only expandable oxygen-generating system on the market? This means that you can start with a system that has one oxygen concentrator generating 10 LPM and add capacity to generate 80, 100, 120 LPM, or even more. Because of this, you can preserve your original investment. This makes the Total Cost of Ownership (TCO) for an HVO system lower than any competing product on the market today.

There are three ways to expand an HVO system:

  1. Get more Oxygen Concentrators
  2. Add a Drone, Storage Tank & Concentrators
  3. Get a Storage Tank
Continue reading How to expand your HVO system