Glassblowing is an ancient art form that has captivated artists for centuries. From delicate ornaments to intricate sculptures, the possibilities with glass are endless. However, one crucial element often overlooked in glassblowing is the necessity for a reliable oxygen supply. In this blog post, we’ll explore the importance of generating your own oxygen for glassblowing and how it can elevate your craft to new heights.
Why Oxygen is Crucial for Glassblowing:
Oxygen plays a vital role in the glassblowing process. It fuels the flame that heats the glass to its molten state, allowing artists to shape and manipulate it with precision. Without an adequate oxygen supply, work sessions are interrupted while supply issues are dealt with. This can result in frustration for the artist as the creative flow is interrupted.
Benefits of Generating Your Own Oxygen:
While there are various ways to obtain oxygen for glassblowing, such as purchasing liquid or compressed oxygen tanks and relying on an external supplier, generating your own oxygen with High Volume Oxygen Systems offer several advantages:
1. Cost-effectiveness: Investing in an oxygen generator may require an initial upfront cost, but it can save an enormous amount of money in the long run compared to purchasing oxygen tanks repeatedly. The return on investment is far better than the interest rates you can get on your money in standard investments or a bank account. No more rental or delivery fees, or hazmat charges that leave you feeling empty with nothing to show for your investment.
High Volume Oxygen CAN help with financing!!! We’ve got a few options to help cut back on the initial investment.
2. Independence: By generating your own oxygen, you’re not reliant on external suppliers or subject to their pricing and availability. This independence ensures uninterrupted crafting sessions and greater flexibility with your time.
3. Sustainability: High Volume Oxygen Systems produce oxygen on-demand, eliminating the need for transportation and storage of compressed gas cylinders. This reduces carbon emissions associated with transportation of heavy cylinders and promotes eco-friendliness. High Volume Oxygen Systems can be run on solar powerand generators off grid, as well.
4. Convenience: High Volume Oxygen Systems come in all sizes, making them suitable for various studio setups. They require minimal maintenance and can be easily integrated into your existing glassblowing studio. They are modular and expandable to grow with you. As your oxygen needs increase, simply add on to your initial investment to generate more oxygen by adding oxygen concentrators to increase your flow, oxygen clean storage tanks to increase your volume, or a drone compressor to increase your compression capacity.
The HVO Classic Plus mini with 10 lpm for small glassblowing studio
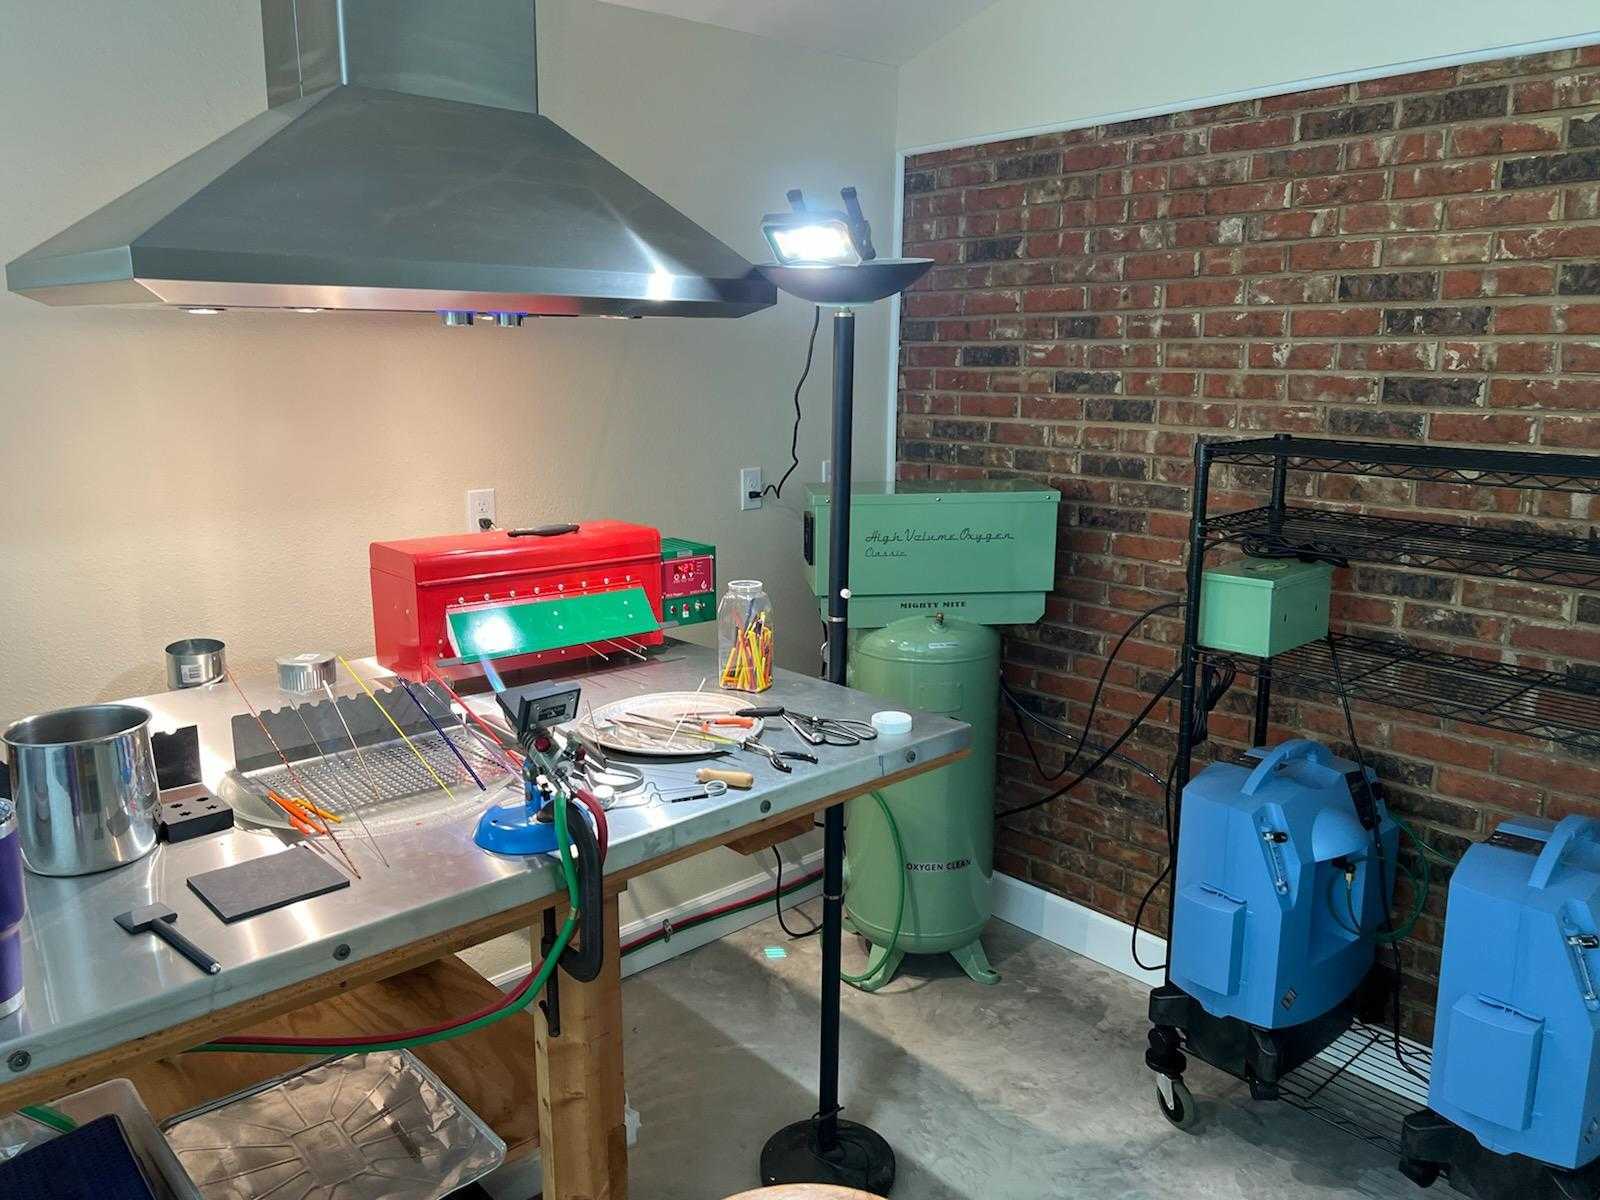
Small glassblowing studio with a High Volume Oxygen System generating oxygen for a torch.
Large HVO System for torches that have high consumption rates, working larger pieces, or multiple small torch studio
HVO Main and Drone Systems power a large glass studio with multiple torch stations for rental and teaching
5. Safe and simple to run and maintain: A plug and play glassblowing oxygen supply like the High Volume Oxygen System is simple to install, while meeting building requirements for a safe oxygen supply. The relatively low pressure of an on-demand oxygen generator for glassblowing like the HVO System is far safer than compressed and liquid tanks and doesn’t require a separate blast room in commercial locations. High Volume Oxygen uses oxygen rated parts and offers you the convenience of DIY oxygen production with the peace of mind that everything will run optimally with limited maintenance, a warranty for parts and labor and liability insurance.
Generating your own oxygen for glassblowing is a game-changer for artisans seeking reliability, consistency, and sustainability in their craft. By investing in a High Volume Oxygen System, you not only elevate the quality of your work but also gain independence and control over your creative process. Embrace the power of self-sufficiency and watch your glassblowing endeavors flourish like never before.
Abstract: This post explains the benefits of maintaining a historical record of minute-to-minute oxygen flow rates. It shows how time-series graphs reveal oxygen consumption patterns, and how these patterns may be correlated with specific activities and events. It explains how a summary of total oxygen usage by week or by month can help to reconcile gas company bills, or plan for the implementation of a new oxygen solution, such as transitioning from compressed cylinders to liquid oxygen (LOX) or an oxygen generator. A scenario is described that illustrates how the use of time-series measurements increases the accuracy of oxygen usage predictions.
Introduction
Oxygen is a significant cost for many applications, from aquaculture to torchwork and scientific glass shops to veterinary clinics and hospitals. Oxygen prices rose significantly during the pandemic(1), and prices remain “sticky” even now in the spring of 2023(2).
With an expensive commodity such as oxygen, the cost of waste adds up quickly. For example, a three L/min line leak will blow off approximately 213 K tanks per year at a cost of $7-8K(3).
There are ways to economize on oxygen, e.g. by using less (e.g. finding and preventing leaks, training users to economize), purchasing an oxygen generator, or switching from compressed cylinders to LOX dewars or bulk LOX. However, before you choose an alternative, it’s important to have a good understanding of your current usage, which is likely to change over time. This may happen for a variety of reasons, such as seasonal business trends and special projects. The more you know about your usage patterns, the more accurately you can budget.
Gas company bills are a source of information that reveals the volume of oxygen that was purchased over a period of time. However, there are two issues with this source:
The bills won’t shed much light on waste. For instance, it would be practically impossible to determine if you have a line leak by looking at monthly volume.
The gas company might not be properly recording the number of tanks you use, perhaps because of administrative errors or faulty measurement devices. If you aren’t keeping an independent record of volume, you won’t know whether your gas company bills are accurate.
To get a more precise view of usage, it’s necessary to measure your oxygen flow rate at regular, sub-minute intervals, over a span of weeks or months. To reconcile oxygen bills, you must also have independent knowledge of the total volume of oxygen consumed over the billing period.
Flow Measurement Devices
Velocity flow meters and mass flow sensors are commonly used to measure gas flow rates. A velocity flow meter provides a point-in-time reading, i.e. the current flow rate. Some flow sensors are capable of storing a limited amount of data in the device for periodic download.
A recent alternative is a mass flow sensor that is able to store flow measurements in the cloud for instantaneous analysis and automated notification when flow rates exceed expected norms.
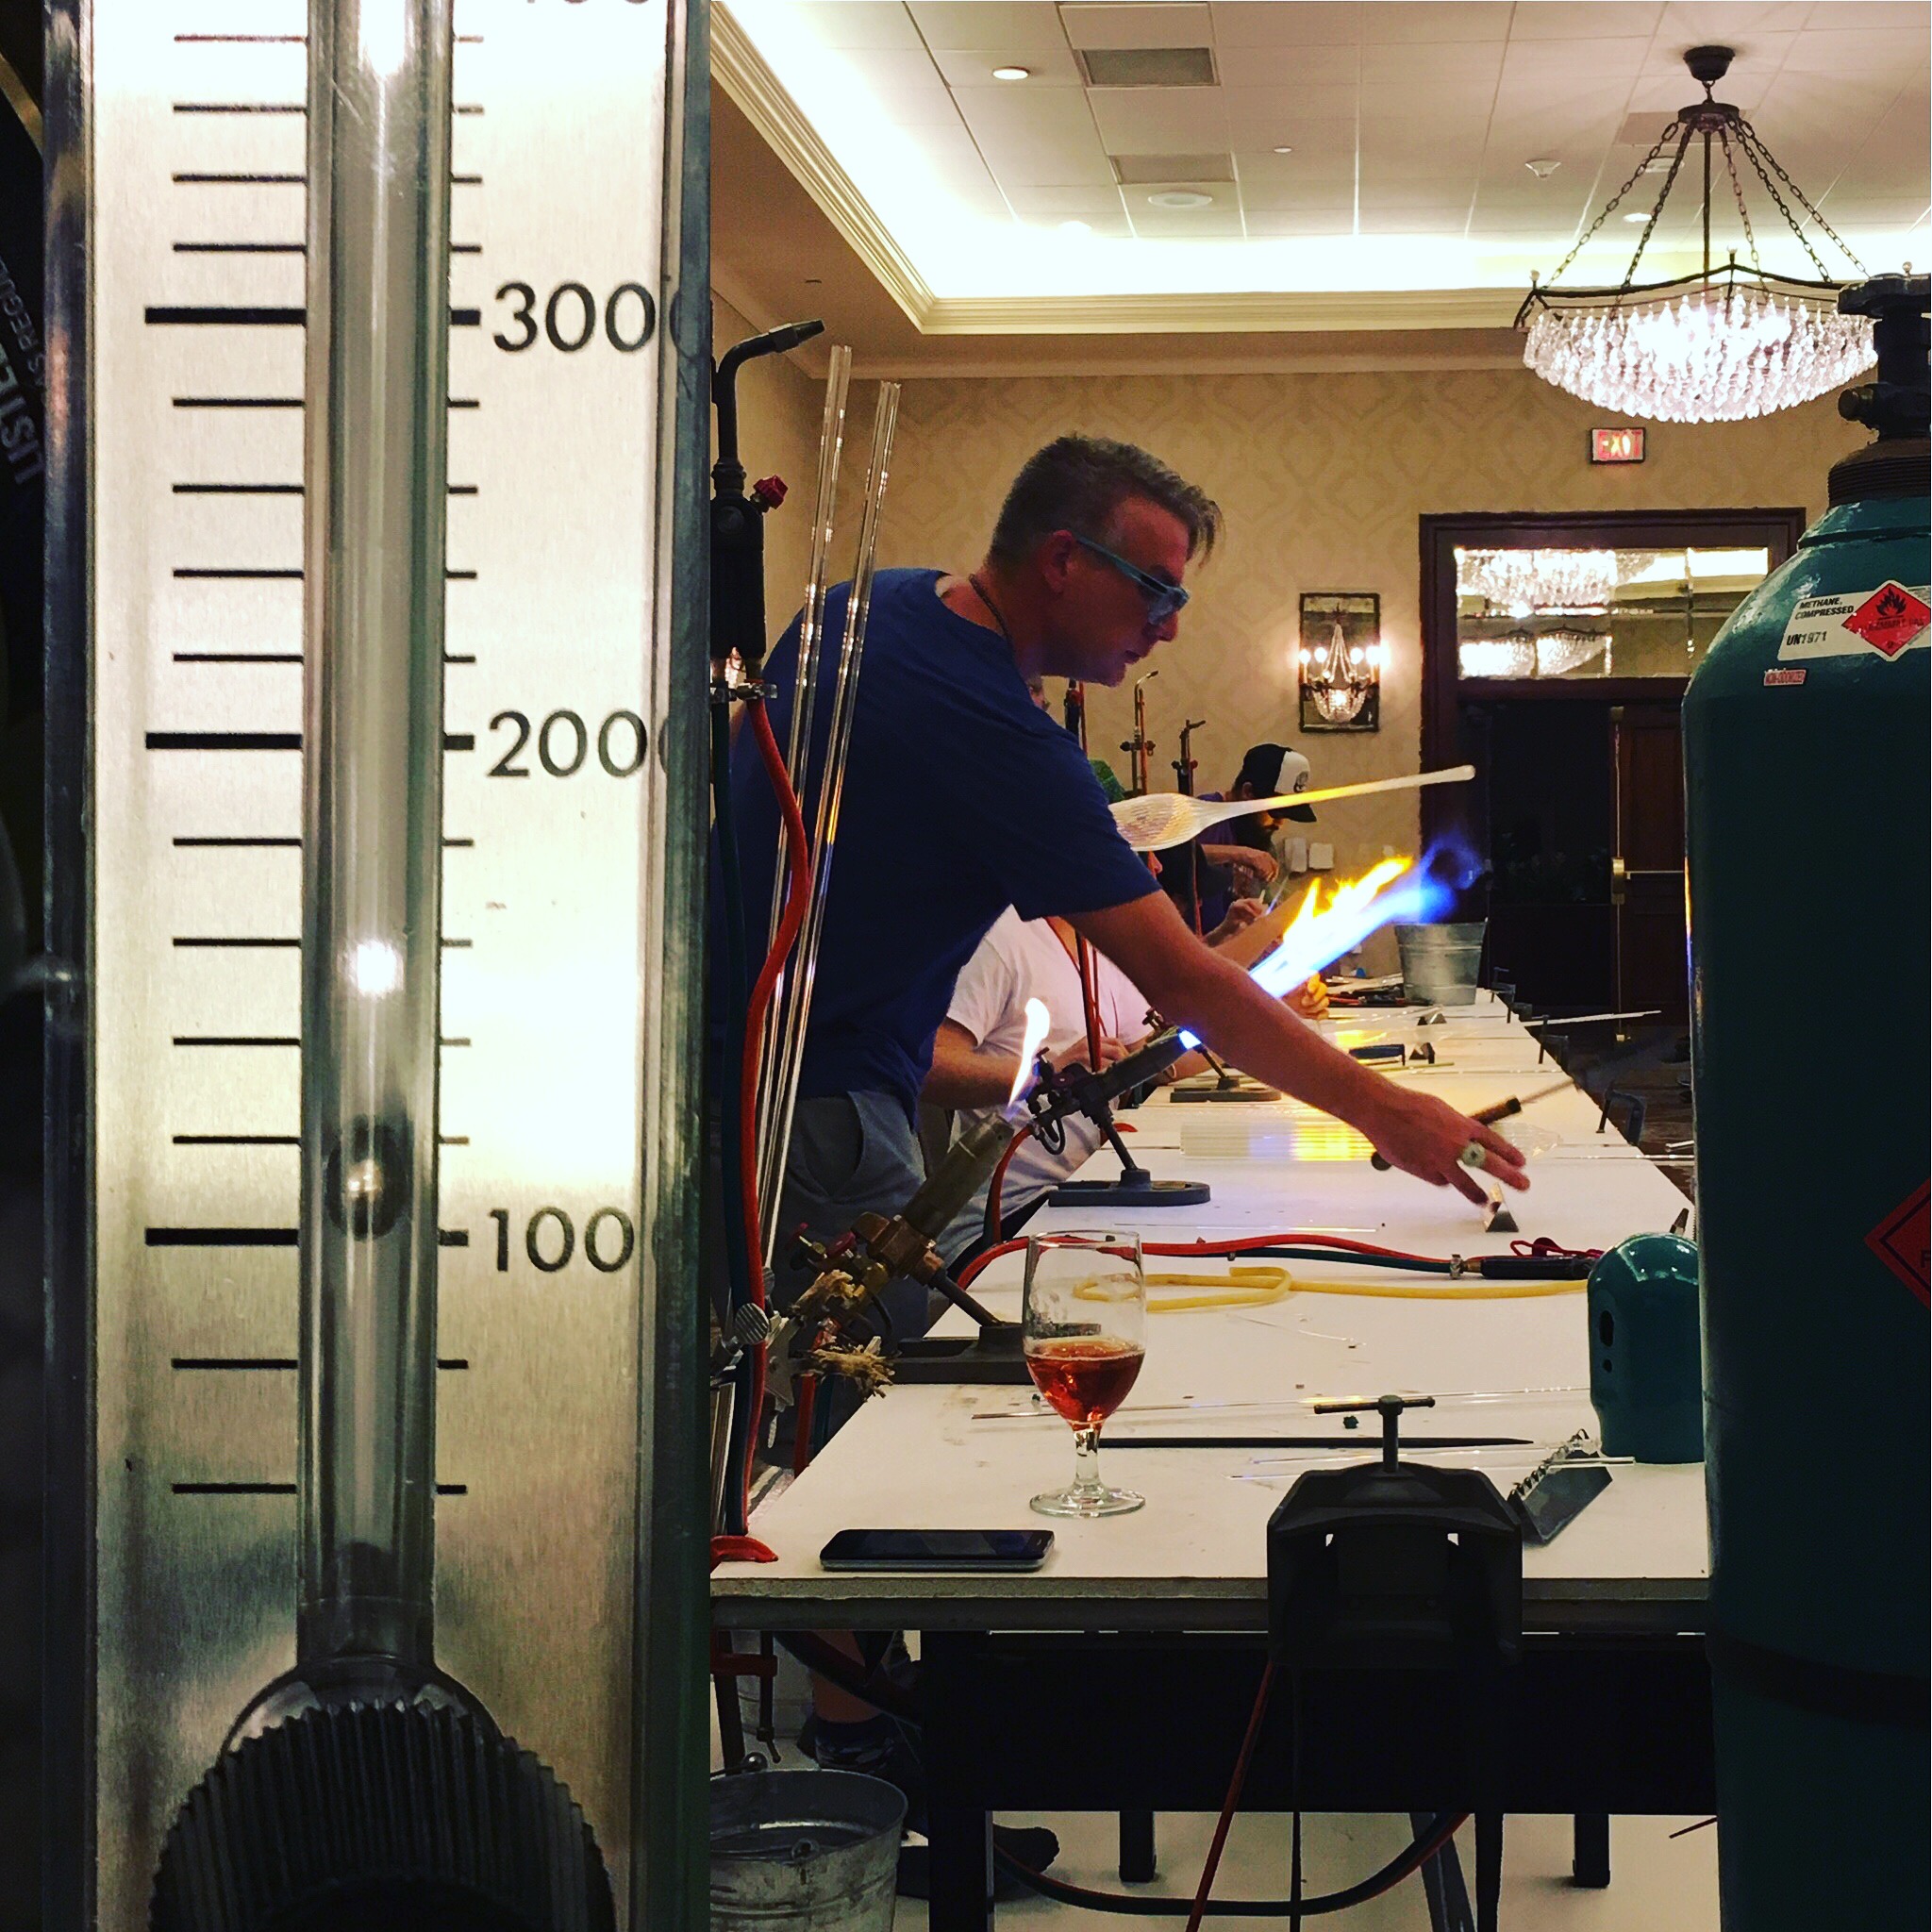
Velocity Flow Meter
A velocity flow meter measures the flow rate of gas by changing the height of a “float” (silver ball) in a graduated cylinder to indicate the approximate flow rate, typically in Standard Cubic Feet per Hour (SCFH) or Standard Liters per Minute (SLPM). You can also use a flow meter to set the flow to a desired rate.
For the purpose of recording flow measurements over time, a flow meter has several drawbacks:
If you want to know what the flow rate was in the past, you need to make regular observations and record them manually. If you want sub-minute measurements, that’s practically impossible to accomplish without automation.
Flow meter accuracy ranges from ±5% to ±10% whereas mass flow sensor accuracy is typically ±0.5% to ±2%.
If the regulator pressure does not match the pressure for which the flow meter was designed, its measurements will be even less accurate.
On a velocity flow meter, the float may be viewed from different angles, which makes it difficult to take consistent readings. However, as a rough gauge of the flow rate, or to set the flow to an approximate rate limit, a velocity flow meter can be a useful tool.
Mass Flow Sensor
A mass flow sensor (MFS) is an electronic device that provides accurate measurements of mass and volumetric gas flow rates. These devices use a hot wire mass airflow sensor to measure the volume of gas entering the device. Its operating principle is similar to a hot wire anemometer, which determines air velocity.
Measurements are collected and converted to digital form, then stored, either in the device’s local memory, or by communicating over a network to another storage device. Some devices support a USB interface, enabling data to be downloaded to a memory stick. Others use RS-232 or RS-485 serial interfaces and must be connected to a receiving device that is designed to collect such data. For specific details about the options available, consult the device documentation for the flow device you are considering.
Mass flow sensor products that store data on a USB memory stick or that transmit data over serial lines require technical skills to download, process, and format the collected data. This can be challenging for day-to-day use.
Keep in mind that mass flow sensors are designed with a set of capabilities, such as the maximum flow rate and maximum pressure. For example, if your line pressure is 50 psig and your flow rate can go as high as 100 L/min, ensure that the MFS device you choose can support those characteristics.
Cloud-Connected Mass Flow Sensor
The HVOOxygen Tracker is a mass flow sensor that provides a convenient alternative to labor-intensive and technically challenging flow devices that require data management. By storing flow measurements in the cloud every 10 seconds, the Oxygen Tracker prevents users from having to manually collect, store, and process data for viewing. Users with an active cloud subscription can access near real-time flow data displayed in a time-series graph on any web browser or mobile device.
The Oxygen Tracker is able to measure flow rates as small as 0.1 L/min and as large as 300 L/min with line pressures up to 100 psig. It can operate in environments where the temperature is 0 to 50 °C (32 to 122 °F). At 21.1 °C (70°F) and 14.7 psia (1 atm), the flow accuracy of the mass flow sensor is ±2% of the reading or 0.05 SLPM, whichever is greater.
Analysis of Graph Patterns
Visualizing time-series flow measurements is key to understanding how oxygen is being used in a given setting. Using an Oxygen Tracker, flow measurements were taken in a glass studio(6) over a 12 hour period. The resulting graph is shown below:
Figure 1. Glass Studio Flow Graph
From the graph above, we can make the following observations:
There was a flow rate of 0.318 L/min at 6:22AM, which is prior to the start of the work day. This is most likely due to a small leak somewhere in the studio.
Just before 7AM, a ball valve was opened that permits the lines in the studio to be filled with oxygen. This caused a spike to almost 80 L/min.
There are variations in the flow rate throughout the work day, with a maximum flow rate of approximately 58 L/min. The average flow rate appears to be roughly 30 L/min.
During the sample period, an oxygen generating system capable of producing 60 L/min would be able to keep pace with demand during peak intervals, and a 30-40 L/min system might actually be sufficient, given that stored oxygen provides the buffer needed during periods of high usage.
Longer sample periods may make it possible to more accurately estimate oxygen usage.
While the glass studio flow graph illustrates a chaotic usage pattern, some applications have more static flow rates. The graph shown in figure 2 (see below) reflects oxygen consumption in an aquaculture operation. During a 6 hour sample period, there is a constant flow of oxygen to a series of fish tanks, so the L/min graph line is nearly flat.
In an aquaculture setting, oxygen gas is converted to dissolved oxygen (DO) so that fish can breathe. According to Henry’s Law(5), the temperature of the water has an inverse relationship to the solubility of oxygen. Thus, the higher the water temperature, the less dissolved oxygen the water can hold. That’s why large fish, which require more oxygen than smaller fish, are struggling to survive in natural settings as global temperatures rise.
Figure 2. Aquaculture Operation Flow Graph
Based on the data in figure 2, one might be tempted to conclude that a flow rate of 10-12 L/min would be sufficient for this application. In reality, the flow rate must be adjusted according to a variety of factors, such as water temperature, fish breed, stage of life (fry, fingerling, adult), and even feeding schedules, since the metabolic rate of fish increases significantly during feeding.
Assumptions about oxygen usage based on a small sample could lead to a significant budget miscalculation. Indeed, the aquaculture operation from which this graph was obtained has since adjusted their constant flow rate to 15 L/min due to rising spring temperatures. Operations managers must periodically measure the DO that’s present in their tanks and make adjustments to the oxygen flow rate in order to achieve the desired levels. With a means to measure the actual volume of oxygen used over time, one is able to create an accurate forecast of the required oxygen volume.
For this reason, the Oxygen Tracker maintains a count of the total volume of oxygen used since the counter was last reset. With an up-to-date cloud subscription, up to a year of flow measurements are maintained in cloud storage. The Seeing Eye™ cloud service sends a weekly usage email report, a sample of which is shown in figure 3 below:
Figure 3. Weekly Oxygen Volume Report
There are several benefits to having detailed data for flow and cumulative volume. First, knowing your precise oxygen consumption over time takes the guesswork out of budgeting. It also makes it possible to determine the economics of alternative oxygen sources. For example, above a certain volume, compressed oxygen cylinders become more expensive per unit of delivered oxygen than LOX dewars. At an even higher threshold, it may be more cost-effective to invest in the installation of a permanent LOX tank. In many cases, an oxygen generator might be more economical. Knowing your oxygen requirements in detail makes it possible to confidently calculate the potential savings from using alternative oxygen sources.
Scenario: A Glass Studio
In this section, we’ll analyze the oxygen used at a Connecticut-based glass studio(6). We’ll calculate the annual cost of oxygen based on monthly gas bills. For comparison, we’ll use measurements collected from a cloud-enabled mass flow sensor to compare predictions about oxygen volume to see how these predictions aid the studio in budgeting.
NOTE: It’s also possible to estimate oxygen usage based on the characteristics of individual torches found in the studio. However, in a large studio, this is rather more complicated, due to the number and types of torches commonly used. Actual measurements are preferable to calculations that rely on assumptions.
What the gas bills reveal
230 Liter Liquid Oxygen Dewar
In 2022, Stoked Glass was purchasing 230L liquid dewars at the rate of approximately one per week at a cost $320 per tank. Thus, they were paying about $320 * 52 = $16,640 per year for oxygen. One of the challenges they experienced was ensuring that there was enough oxygen. Since their oxygen consumption was inconsistent, there were times when they would run out unexpectedly. For unscheduled deliveries, it was necessary to wait 3-5 days before oxygen would be delivered. In these circumstances, the shop had to shut down, resulting in significant losses in production and revenue.
In mid-2022, the local oxygen supplier was acquired by AirGas, and prices immediately went up. This led to the glass studio’s decision to purchase an oxygen generator.
The gas bills reveal how much oxygen is being purchased by week, month, and year, and the cost in those time frames. However, they can’t be used to determine how much oxygen is wasted due to off-gassing, line leaks, or inefficient usage. Nor can they use them to correlate the approximate cost of oxygen for individual projects. More granular usage information is needed to gain these types of insights, which are an aid to economize.
What the Oxygen Tracker reveals
At the end of December, 2022, an Oxygen Tracker was installed at Stoked Glass. After a few days, they were able to look at graphs that show a profile of the specific oxygen flow rates they experience throughout the day. The graph below shows a 96 hour period, which provides some insight into daily usage patterns:
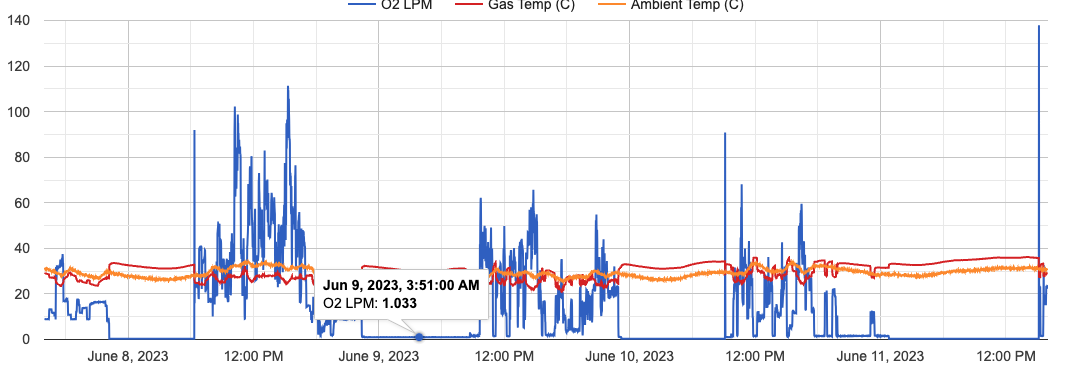
Figure 4. A time-series graph showing 4 days of oxygen flow rates
From the graph above, we begin to understand what a typical day looks like in terms of expected flow rates. Here are a few insights we have gained:
More oxygen was consumed on June 8th than in the next three days.
Work started at 9am EDT on June 8, 11am EDT on June 9, and 1pm EDT on June 10
At the end of the day on June 8th, someone forgot to turn off the ball valve that releases oxygen to the studio gas lines. We know this because 1) there was no spike in the flow rate the morning of June 9th indicating the opening of the ball valve, and 2) there was a leak of just over a liter per minute for about 12 hours, which is greater than the usual leak of about 0.3 LPM.
The maximum flow rate reached 110 L/min, but flow rates from 40-80 L/min were more typical.
The average flow rate over this brief period was approximately 40 L/min.
Coupled with the knowledge of who was in the shop on a given day and time, one might identify prodigious users of oxygen – not to point fingers, but perhaps as an opportunity to train more efficient techniques.
That’s quite a few valuable insights from a single graph. Visualization of flow data is an excellent way to understand the utilization of this valuable resource. Having a year’s worth of data could enable managers to budget more effectively, as well to be able to correlate projects with oxygen cost to better account for the shop’s own costs.
Conclusions
Analog flow measurement devices provide point-in-time readings, which are of limited usefulness for making accurate forecasts.
Some digital flow measurement devices are able to save historical readings locally or transmit them to a database. However, data processing is needed to produce graphs and other kinds of reports, which is challenging for small organizations.
Having easy access to granular oxygen flow rate data can facilitate more effective and more economical management of oxygen resources.
References
Reuters reported in May 2020 that the cost of medical oxygen had risen by as much as 50% in some countries due to increased demand and supply chain disruptions. The Economic Times reported in April 2021 that the cost of medical oxygen in India had increased by more than 3-4 times due to the surge in COVID-19 cases. The Guardian reported in April 2021 that the cost of medical oxygen in Nepal had increased by up to 800% due to the surge in COVID-19 cases. The Straits Times reported in April 2021 that the cost of medical oxygen in Malaysia had increased by as much as 40% due to the COVID-19 pandemic.
The unit cost of delivered oxygen can be difficult to parse out of a complicated invoice. There are many factors, such as compressed vs. liquid, distance of delivery, tank rental vs. stationary platform. Anecdotally, users of oxygen in the aquaculture, glass, and veterinary industries are purchasing oxygen generators such as HVO systems specifically because delivered oxygen continues to go up in price.
A K-tank (aka H-tank) contains about 7400 liters of oxygen at a pressure of about 2200 psig. This calculation assumes a cost of $45 per K-tank.
When considering a High Volume Oxygen system to replace your dependence on compressed or liquid oxygen tanks, there are various considerations. Knowing how much oxygen you go through in a set period of time is a great way to figure out which High Volume Oxygen system will work best for you. It helps to know how long a tank of oxygen lasts you, but short term usage is also helpful to make sure you get a system that can keep up with you. How do you figure out your short term usage? Start with your torch(es).